Photo by Jason Richard on Unsplash.
In 2021, New Jersey American Water completed hundreds of millions of dollars’ worth of capital projects on its water systems across the state, including installing 71 miles of transmission mains, replacing 548 fire hydrants and 2,430 valves, rehabilitating four water tanks, upgrading multiple treatment plants, and replacing 9,006 service lines. These are a handful of the thousands of infrastructure investments that water utilities completed across New Jersey. In the past, however, the total annual amount of capital invested into our utilities statewide was unknown. Now, thanks to data collected by the state, we have a more precise notion of which drinking water capital projects are being undertaken and whether the infrastructure funding available will be adequate.
The 2021 amendments to the Water Quality Accountability Act (WQAA) mandated an annual reporting of capital projects. Each public community water system with more than 500 service connections must report on the infrastructure improvements undertaken in the past year, the improvements to be made over the next decade, and the costs of those improvements. This data is providing insight into the cost of improving water infrastructure across the state.
A total of 211 drinking water systems provided responses to the WQAA Capital Improvement Report in 2022 , representing 88 percent of all drinking water customers statewide¹. These 211 water systems have more than a collective $4.7 billion invested in capital improvements which are planned or will be in progress for the next three years. There is a huge range of capital improvements underway, ranging from as little as $10,000 at one system to as much as over $400 million at other systems.
Planned and In-Progress Drinking Water Capital Improvements for the Next Three Years in New Jersey Will Total
$4,712,166,552
* Based on 211 responses to the 2022 WQAA Capital Improvement Report, representing 88 percent of all drinking water customers statewide
There is likely some inconsistency in what utilities consider to be capital projects, but this number is the closest New Jersey has ever had to a statewide figure for total need for drinking water infrastructure funding.
Many of the highest planned and in-progress totals come from utilities that serve a large number of people, a large geographic area, or both. One way to compare capital expenditures between utilities of various sizes is to look at the cost per connection. What, on average, will each customer need to pay in order to cover the cost of the capital improvement?
Again, there is a great disparity in the numbers. Customers at most utilities will pay, on average, between a few hundred and a few thousand dollars for capital projects. At a handful of utilities, the cost per connection reaches tens of thousands of dollars.
The capital improvements for most utilities will cost between a few hundred dollars and a few thousand dollars per connection for most utilities.
The actual amount each customer will pay depends on the utility’s rate structure, the customer’s class (residential vs. commercial, for example), and how much water that customer consumes.
Drinking water is often described as having economies of scale. There is a minimum cost to infrastructure, regardless of how many customers a utility serves, and utilities with more customers can spread these costs out across more accounts, limiting the amount each individual customer must pay. The data on cost per customer supports the notion that drinking water has economies of scale. For all utilities, the cost per connection increases on average as the number of connections at the utility decreases. This remains true if utilities are divided into small, medium, and large based on the number of people they serve. Customers at smaller utilities are likely to pay more per connection for infrastructure improvements than customers at larger utilities.
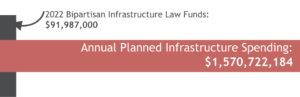
Where will the money come from to cover this infrastructure need? In 2021, President Biden signed the Bipartisan Infrastructure Law, also known as the Infrastructure Investment and Jobs Act. The drinking water sector is set to receive more than $35 billion over the next five years to address infrastructure upgrades, lead service lines, and emerging contaminants.
The Bipartisan Infrastructure Law is touted as a “once-in-a-generation” investment in water infrastructure. New Jersey will receive an additional $92 million this year for drinking water infrastructure beyond its typical allocation for the state revolving loan fund. But the need for water systems in NJ is far greater.
For this reason, the New Jersey Water Bank leverages its funds from the federal government on the bond market, allowing the state to loan out much greater sums to water utilities. Whatever funds are not needed to repay the bonds are then loaned back out to more systems, allowing more infrastructure projects to be completed over time. New Jersey also became the first state in the country to receive funding from the State Infrastructure Financing Authority Water Infrastructure Finance and Innovation Act (SWIFIA) program, receiving a $500 million loan in January 2023. Water utilities can also access funds from the Environmental Protection Agency (EPA) directly through the Water Infrastructure Finance and Innovation Act ( WIFIA )program, from the United States Department of Agriculture (USDA) if they serve 10,000 or fewer people, and from private capital markets. New Jersey’s water infrastructure needs alone over the next 20 years totals $26 billion², which means that there is much work yet to be done.
As more years of capital project data are collected, more analysis will be possible, such as:
- Which projects are being completed on time?
- Did the cost of individual projects change over time, and how much is inflation impacting capital costs?
- Is there a cost to delaying capital improvements?
- How much infrastructure funding will be needed in New Jersey in the next decade?
- Does the difference in cost of infrastructure improvements per customer due to utility size raise any concerns around affordability or equity?
One important source of data to answer these questions will be Jersey WaterCheck. Jersey WaterCheck was created by Jersey Water Works (JWW) to tell the story of our state’s water and wastewater infrastructure needs. One of JWW’s shared goals is Effective and Financially Sustainable Systems, and under the subgoal Wise Management and Spending, Jersey WaterCheck reports the estimated cost of planned capital projects over three years at both the state level and system level. Jersey WaterCheck data will be updated annually.
¹ Based on requested data shared (Sept 7, 2022) by NJDEP for Jersey WaterCheck 2022 update. Additional water utilities may have submitted WQAA Capital Improvement Reports after that date which is not reflected in this analysis.
² Data sources EPA 2018 Drinking Water Needs Survey , Exhibit 2.1 in https://www.epa.gov/sites/default/files/2018-10/documents/corrected_sixth_drinking_water_infrastructure_needs_survey_and_assessment.pdf & EPA 2012 Clean Water Needs Survey, Appendix A in https://www.epa.gov/sites/default/files/2015-12/documents/cwns_2012_report_to_congress-508-opt.pdf