The total cost of drinking water for residential customers in New Jersey is increasing. The New Jersey Department of Environmental Protection (NJDEP) collects data annually on how much residential customers pay for water. In 2020, the median total cost to a residential billed customer with a ⅝” meter for 50,000 gallons¹ used per year statewide was $339.10. In 2022, the most recent year for which NJDEP has data, that amount had risen to $363.00. This post will explain how the price of water has increased over the past few years and explore four reasons for that increase.
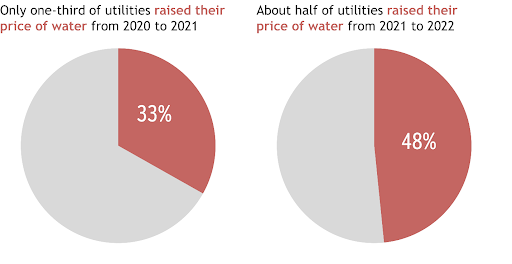
The median total price of 50,000 gallons of water was relatively stable from 2020 to 2021 but rose by about six % in 2022. As the figure below shows, more utilities raised their rates from 2021 to 2022 compared to 2020 to 2021.

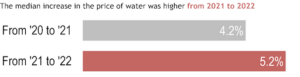
The amount of the increase was also greater from 2021 to 2022 as compared to from 2020 to 2021, as the figure below shows.
There are four likely reasons that drinking water rates were higher in 2022 and were increasing at a higher rate.
#1. Utilities held off on rate increases during the worst of the COVID-19 pandemic
One likely reason fewer utilities increased their rates from 2020 to 2021 was the COVID-19 pandemic, which had a significant economic impact on the state’s residents. According to a 2021 report from the New Jersey Department of Labor and Workforce Development², New Jersey lost nearly 720,000 jobs during the first two months of the pandemic. By September 2021, only about 60% of those jobs had returned, ten percentage points below the national average. In addition, in 2020, Executive Order 190 put a moratorium on water shutoffs for non-payment. The economic and political climate was not conducive to rate increases, so many utilities likely held off on increasing their rates, even if their costs may have been rising. As the impacts of COVID-19 began to ease in 2022, more utilities were likely willing to raise rates.
#2. Inflation
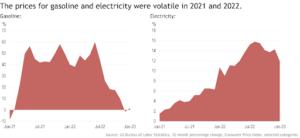
Another likely reason there were more rate increases in 2022 compared to 2021 is due to inflation, the cost of goods and services increasing over time. The Federal Reserve, the central bank of the United States, has worked to keep inflation around 2% per year since 1986 and adopted an official 2-percent-per-year target in 2012.³ Inflation, however, has been much more volatile over the past three years since the start of the COVID-19 pandemic. The charts below show how volatile the year-over-year changes in gasoline and electricity were in 2021 and 2022.
In addition, the pandemic and aftermath resulted in major supply chain disruptions, increasing the cost of capital projects even more than consumer price inflation. The cost of water utility operations and maintenance and the cost of capital projects likely rose more from 2021 to 2022 than from 2020 to 2021, necessitating a higher price increase. More recently, inflation has been easing, and the supply chain conditions have been improving, which may help in 2023 and beyond.
#3. New Regulations
Water utilities are facing new regulations from both federal and state governments, particularly regarding the identification and removal of lead service lines. In New Jersey, new regulations for treating PFAS chemicals also pose high costs to affected utilities. These new regulations are essential to protect the health and safety of our state’s residents, but any new regulation, no matter how necessary, will likely increase both the daily operations and maintenance costs for utilities and capital costs. Costs are expected to rise over the next several years due to new federal and state regulations on PFAS and other emerging contaminants.
#4. Capital Projects
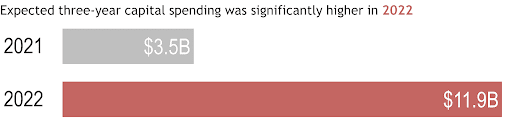
NJDEP asks utilities to estimate their planned capital projects over the next three years, and 151 utilities reported figures for 2021 and 2022. The figure below shows that the expected three-year spending on capital projects was more than three times higher in 2022 than in 2021.

State requirements for asset management plans force utilities to identify high-priority projects that previously might have been ignored. Some of these capital projects will be paid for by grants or principal forgiveness on state Water Bank loans, but utility customers will ultimately be responsible for paying for most of the cost of these projects. Higher capital spending leads to higher customer rates.
Inflation and new regulations are two of the most likely reasons utilities plan to spend more money on capital projects over the next three years. More projects are required to comply with new regulations, and the cost of all projects is increasing. A third likely reason for increased capital spending is that more money is available for water infrastructure projects. The Bipartisan Infrastructure Law significantly increased the funds available through the State Revolving Fund, operated by the New Jersey Water Bank. Utilities don’t want to miss out on what has been touted as a “once-in-a-generation” investment, so more are applying for funding than ever before, a trend seen nationwide.
With inflation continuing to be above 2% per year and new regulations continuing to be implemented, it would not be surprising if the cost to residents for drinking water would continue to rise in 2023 and beyond. An important source of data to monitor this trend will be Jersey WaterCheck.
Jersey Water Works (JWW) created Jersey WaterCheck to tell the story of our state’s water and wastewater infrastructure needs and updates it annually. Jersey WaterCheck brings together a mix of publicly available and reported data and data collected from utility websites. By putting this information in one place, Jersey WaterCheck can help New Jersey residents, decision-makers, and water system managers understand the status of water utility systems at the state and utility level. To access Jersey WaterCheck go to: https://www.njwatercheck.com/. To learn how to use Jersey WaterCheck, check out this easy-to-understand video.
¹ This refers to the cost to a residential billed customer with a 5/8″ meter ( pipe diameter) for 50,000 gallons used per year, according to the utility’s Capital Improvement Project data submitted to NJDEP under the Water Quality Accountability Act (WQAA). Note: To make tap water potable and deliver it reliably, your drinking water system’s rate structure needs to ensure there is enough revenue to meet all needs. These needs include pumping, treating, distributing, operating, and maintaining the system to meet all state and federal regulations. Low rates are not necessarily better than high rates, since water systems need revenues to upgrade and maintain pipes and treatment plants to keep them running as efficiently and reliably as possible, to comply with government regulations, and to meet customers’ expectations. It is important to understand this when making any comparisons with other systems and/or personal utility bills. Information in this metric can help convey how the cost of tap water compares to that of bottled water, which is often more expensive and contributes to pollution. Systems should regularly update their rate schedule to reflect the true cost of providing your service.
³ https://fredblog.stlouisfed.org/2020/11/from-inflation-targeting-to-average-inflation-targeting/