An analysis of New Jersey estimates water and sewer costs pose affordability concerns for roughly one-fifth of all households.
Nationally, the residential household costs of drinking water and sewer utility services have been increasing faster than the consumer price index (inflation) and faster than median household incomes since the 1980s. What was once a minor cost has become a significant burden for many households.
An important point is that water and sewer utility costs are only one part of the overall cost of living in New Jersey. Ideally, public policy would address affordability broadly, as a household that can’t afford water and sewer likely can’t afford other costs as well. However, in the absence of broad policies, we must look at specific household costs to determine where unusually high stresses exist.
Measuring the problem of affordability for households is difficult, in part because there is no national consensus approach on how to do so. In addition, much of the information needed for a clear picture is not readily available. As with so many policy issues, it is difficult to manage what hasn’t been measured. That was the challenge facing Jersey Water Works when it sponsored research on this issue in 2017, resulting in three reports by a Rutgers researcher, Professor Daniel Van Abs, and New Jersey Future researchers Tim Evans and Kimberley Irby, on methodology options (2018), a New Jersey methodology (2020), and application of that methodology using New Jersey data (2021). Recently, the 2021 study was adapted for publication in the American Water Works Association Water Science journal. With the 2021 study results available, New Jersey is now poised to determine what should be done to address these affordability issues, as we already have for residential energy demands.
Water and sewer utility costs vary a great deal in New Jersey. A household using a modest 45,000 gallons per year (sufficient for the indoor water uses of an average three-person household) could pay anywhere from less than $100 to $1600 for both utility services, depending on which specific utilities serve their home. The statewide average was $673 in 2021, based on costs from 266 drinking water utilities and 328 sewer utilities, covering more than 90 percent of those with such services. Most people pay these costs directly, but renters often pay them indirectly, through their rental costs. With a wide range of costs and a wide range of household incomes across the state, the research team developed an approach that analyzes affordability at the neighborhood level, using Census Bureau data.
The methodology is based on a recent approach developed by Professor Manuel Teodoro, now with the University of Wisconsin. Simply put, the assessment compares the utility costs for a typical household against the disposable incomes for each census tract. Disposable income is a household’s total income minus essential expenditures (for example, housing, energy utilities, food, transportation, medical); the essential expenditures were determined for each county because the cost of living varies greatly between counties. Where utility costs exceed 10 percent of household disposable income, the household is considered to have an affordability issue.
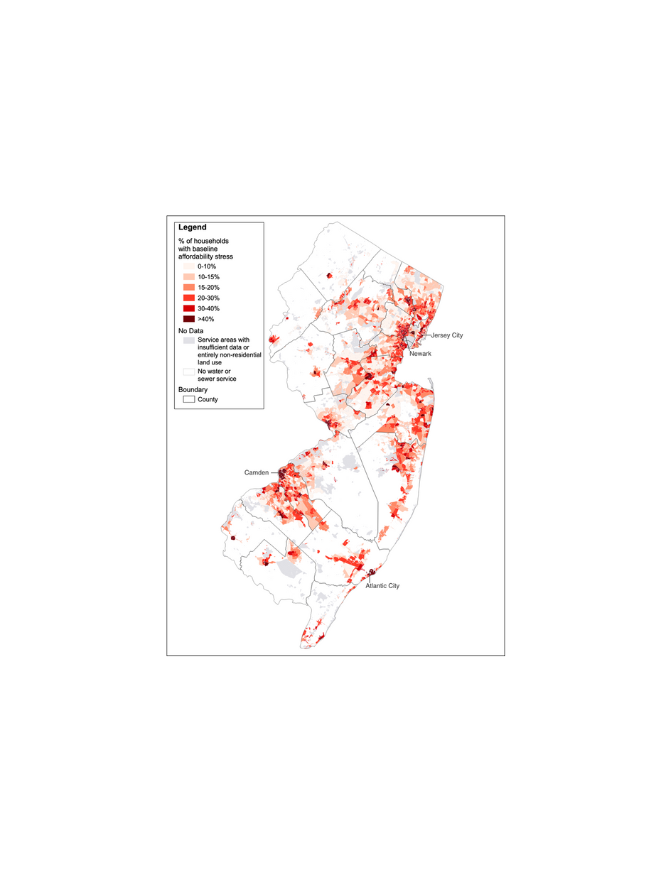
The results are shown in this map, with deeper colors indicating a higher percentage of households with affordability concerns. A key point is that affordability concerns are not confined to historic urban areas. Many suburban areas (e.g., Pequannock, Keansburg, Maple Shade, Lindenwold, parts of northern Ocean County) and rural town centers (e.g., Flemington, Salem, Bridgeton, Newton) have high rates of affordability stresses.
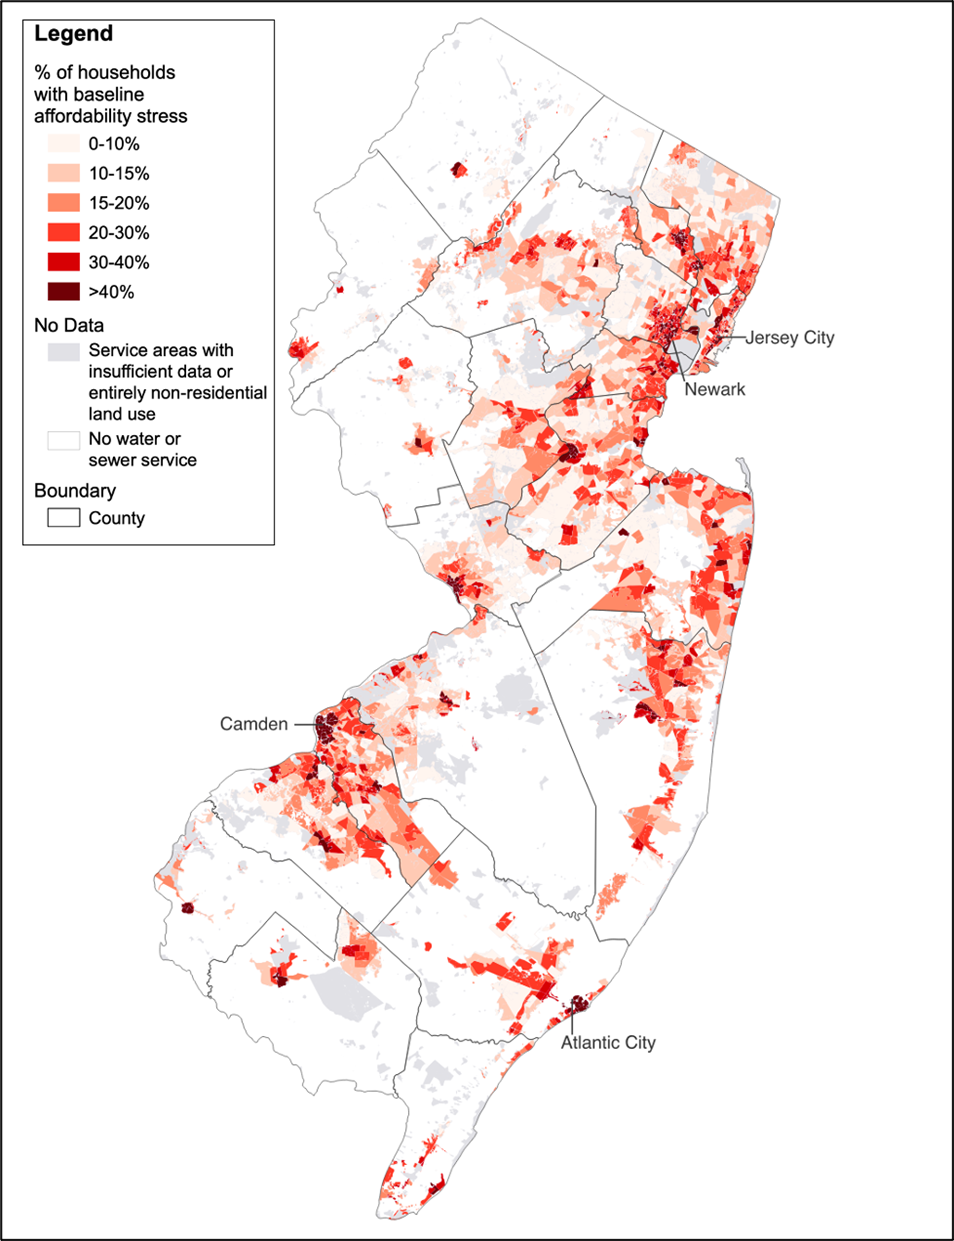
While low-income households often have water and sewer utility costs about the 10 percent threshold, that isn’t always the case, as some areas have unusually low utility costs. Likewise, most households with higher incomes, such as between the 20th and 40th percentile income, will not face affordability stresses, but that isn’t always the case, as some areas have unusually high utility costs. Some counties have higher incomes in general, but also higher costs of living for essential expenditures, making it harder for households to afford these utility costs. And for the areas with the highest stresses, the utility costs range widely as well.
Further research also indicates that affordability stresses occur across areas with a wide range of populations that are other than non-Hispanic White, with little correlation until the highest percentages, about 60 percent. Some areas with relatively high percentages (in the 40 to 60 percent range) have relatively low combined water and sewer utility costs, reducing the impact on households. This is potentially due to many urban areas with high concentrations of racial minorities being served by large regional utilities that spread their costs and revenues over large geographic areas, enabling a degree of de facto internal cross-subsidization.
What the research makes clear is that water and sewer utility affordability stresses are widespread in New Jersey and heavily dependent on an intersection of high utility costs, high costs of essential expenditure, and low disposable income. The methodology can be applied usefully at the neighborhood, utility, municipality, county and state level. In particular, it could be used to compare other data items collected by water and sewer utilities with demographic and socioeconomic data from the Census Bureau and other sources, to shed further light on the financial stresses that utilities’ customers may be facing.